CVPR 2026

UDAPose: Unsupervised Domain Adaptation for Low-Light Human Pose Estimation

Haopeng Chen1 Yihao Ai2 Kabeen Kim3 Robby T. Tan2,4 Yixin Chen1 Bo Wang1

1 University of Mississippi 2 National University of Singapore 3 Duksung Women's University 4 ASUS Intelligent Cloud Services (AICS)

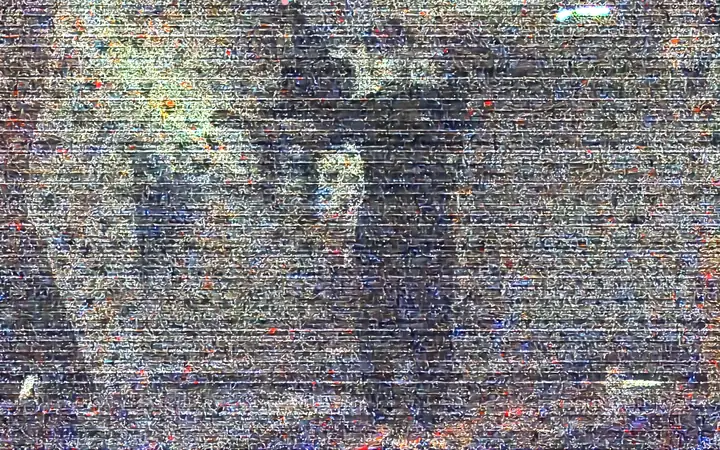
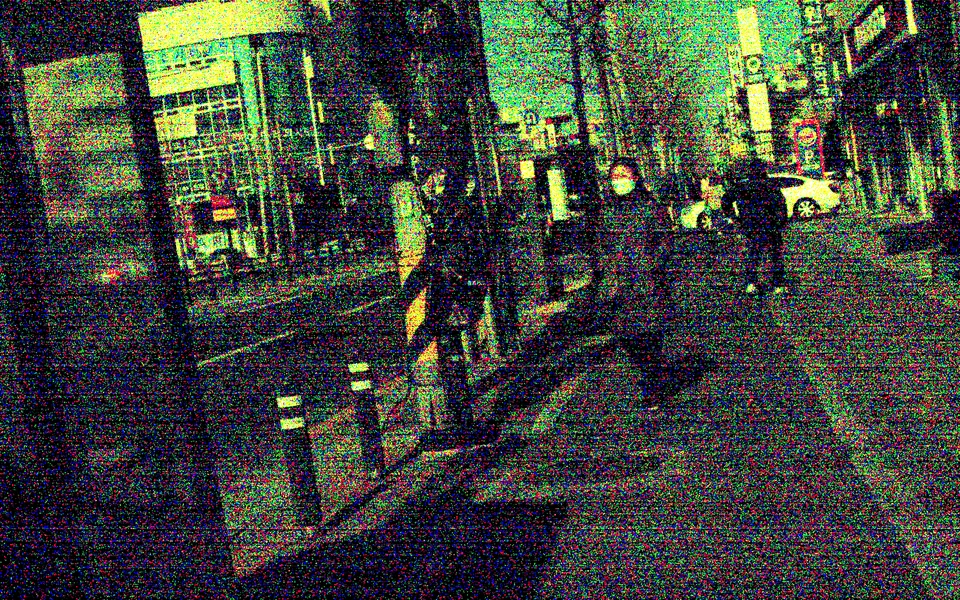
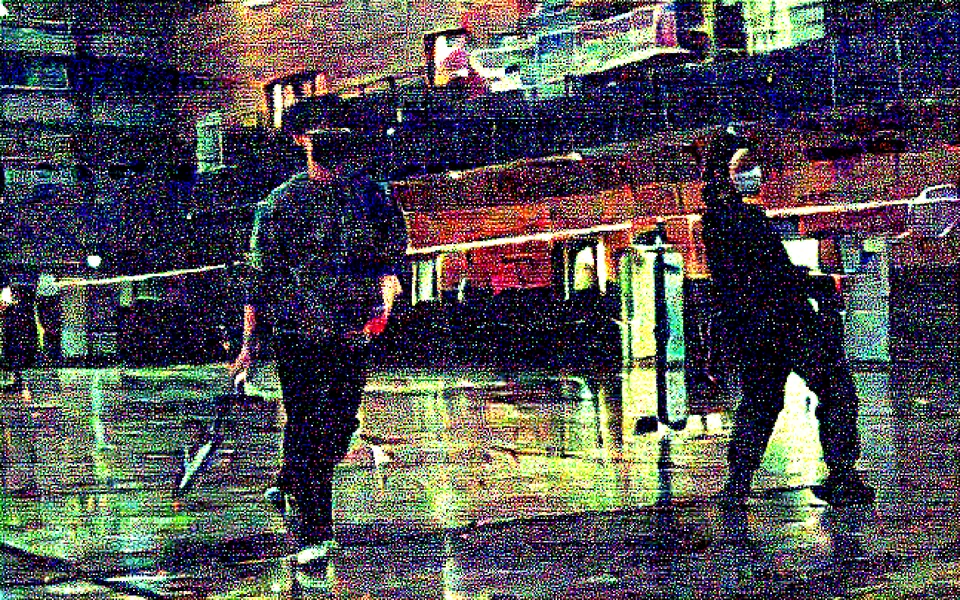
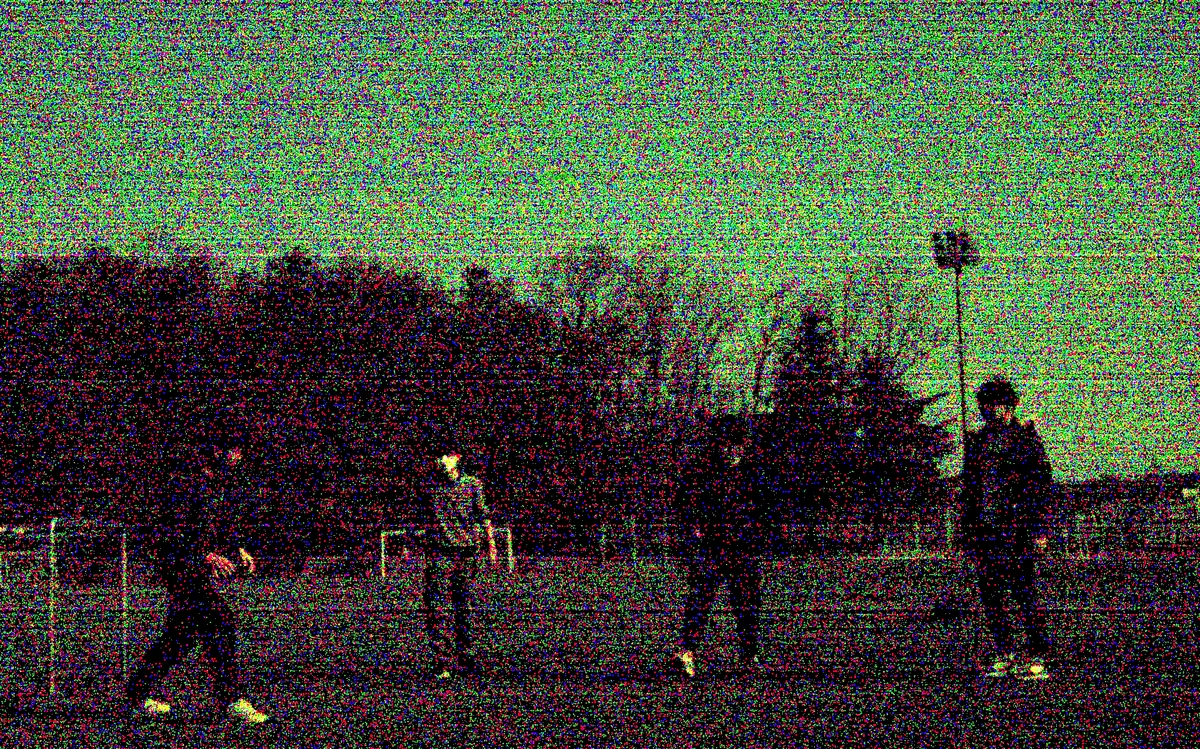
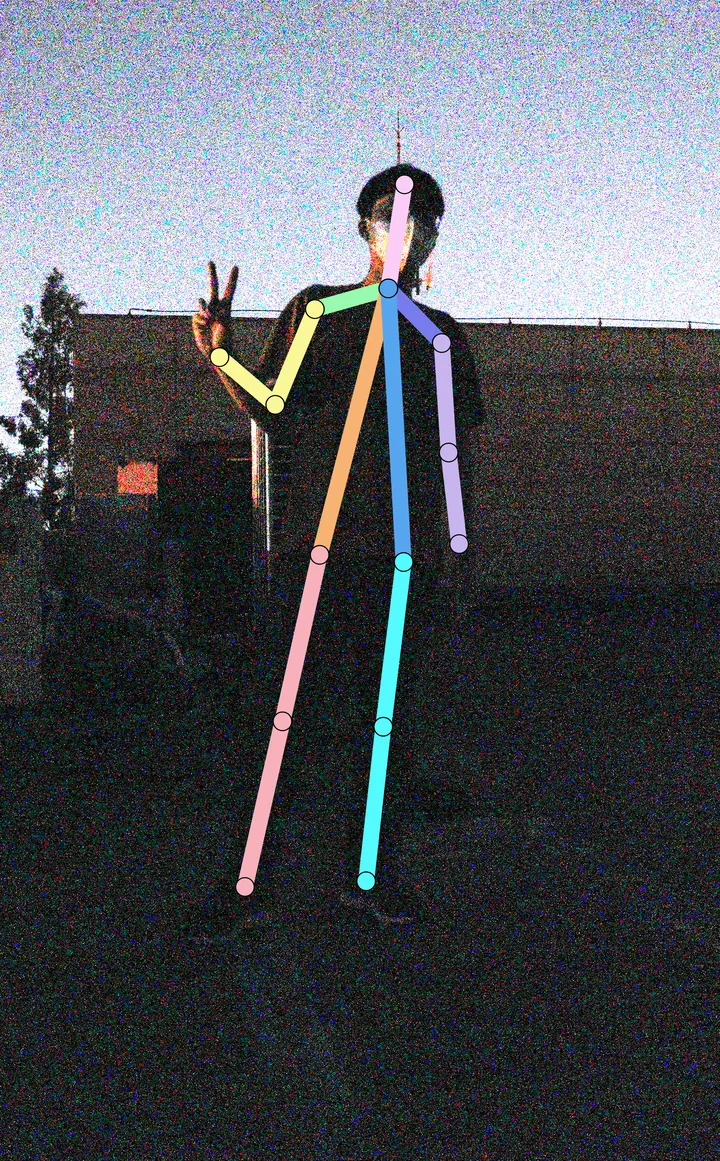
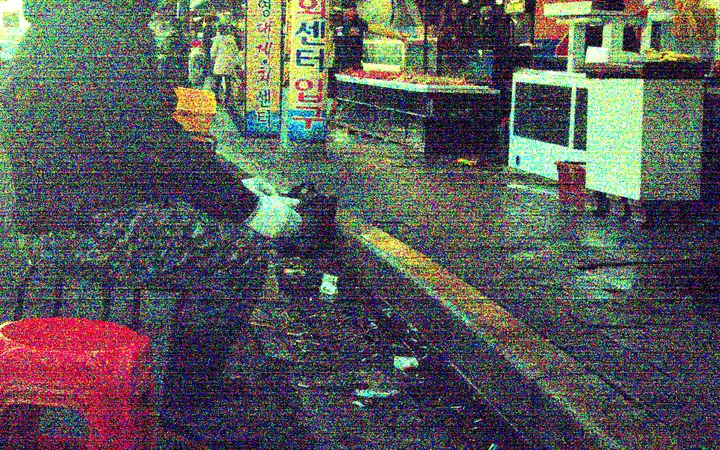
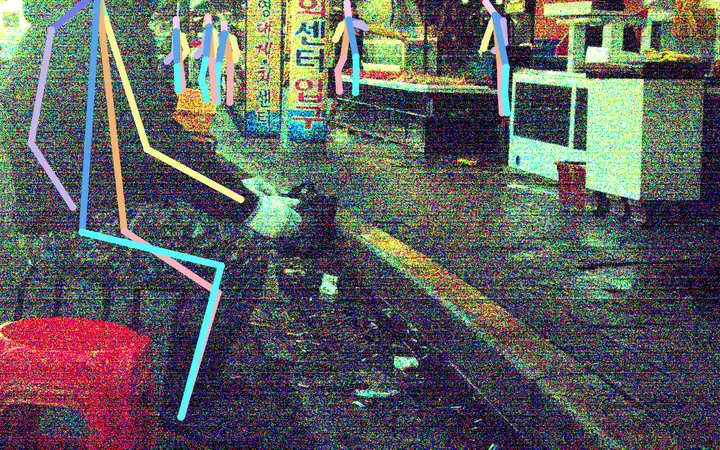
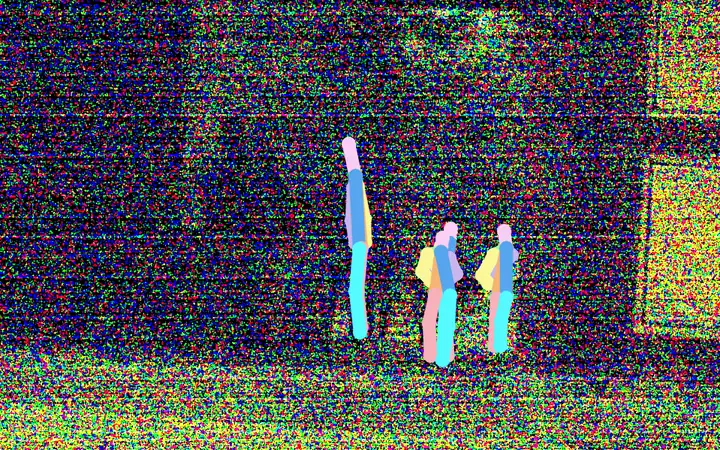
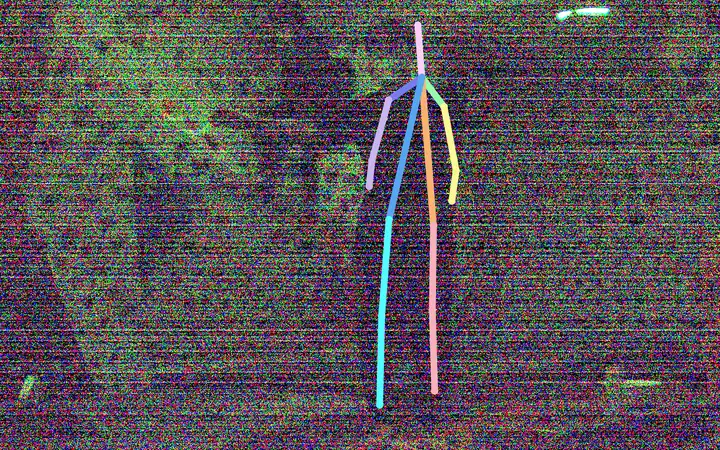
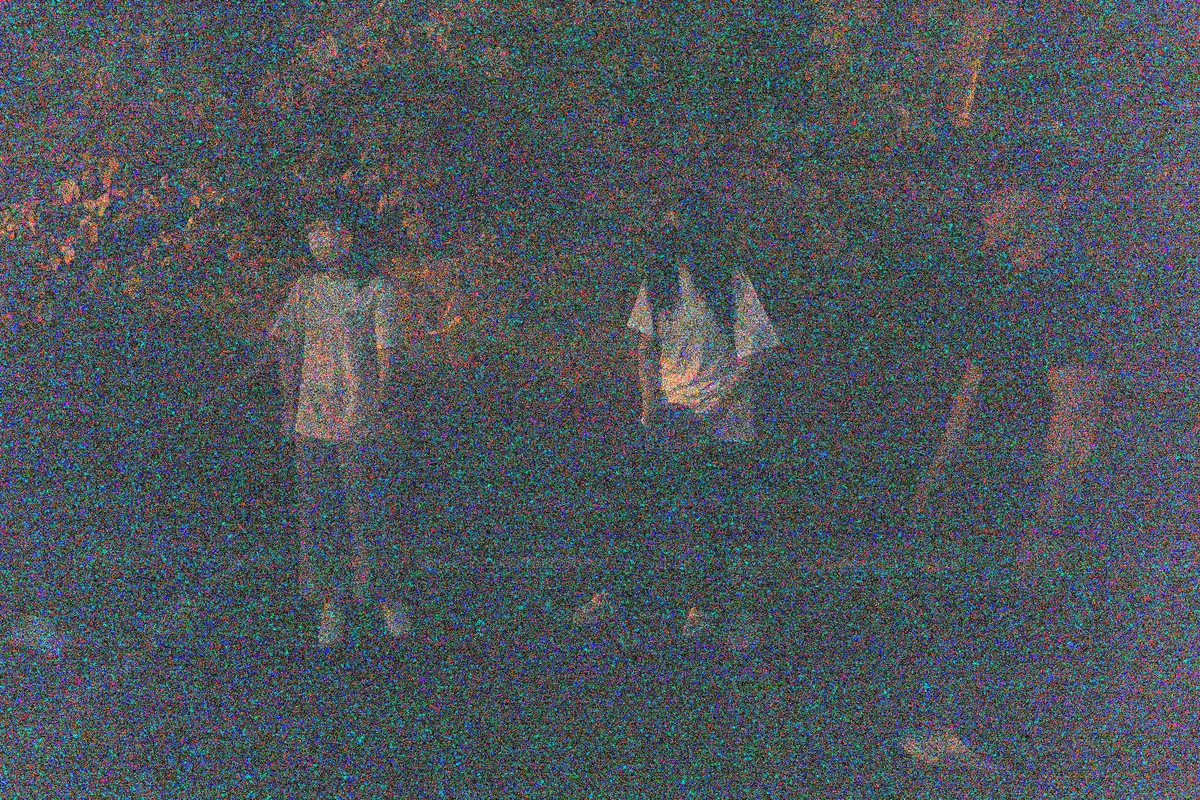
This is the input.
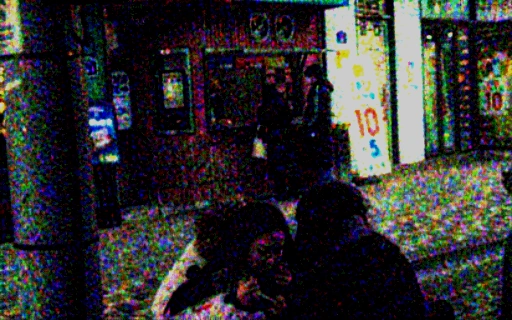
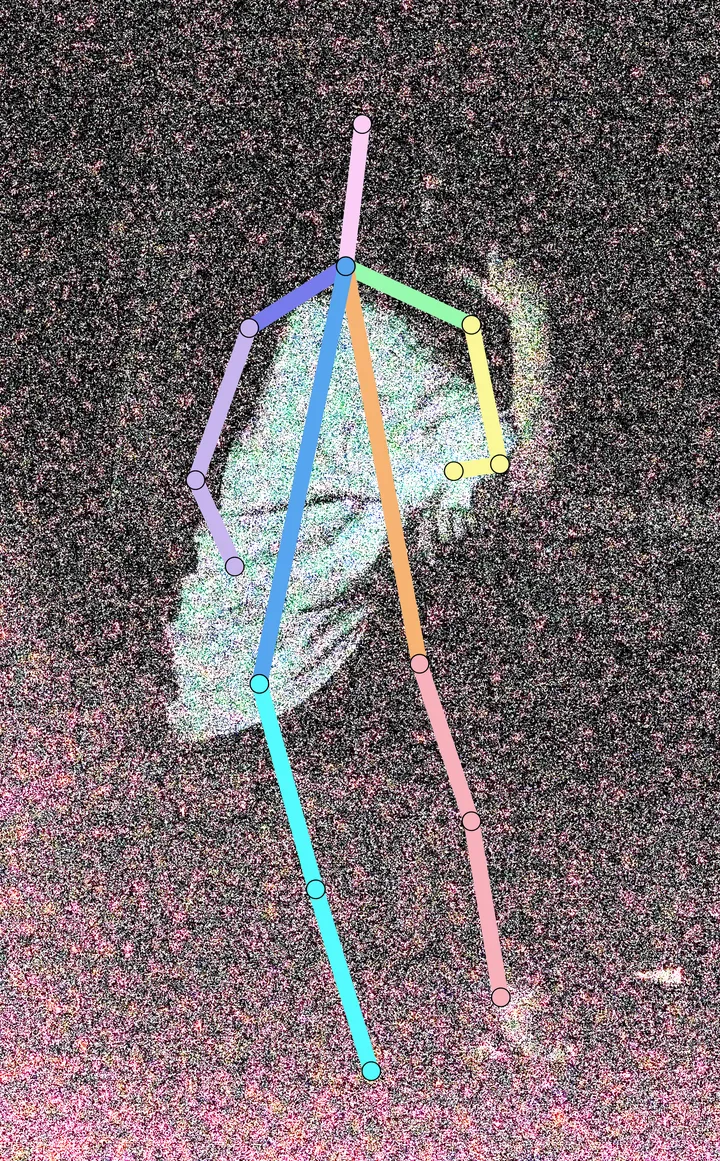
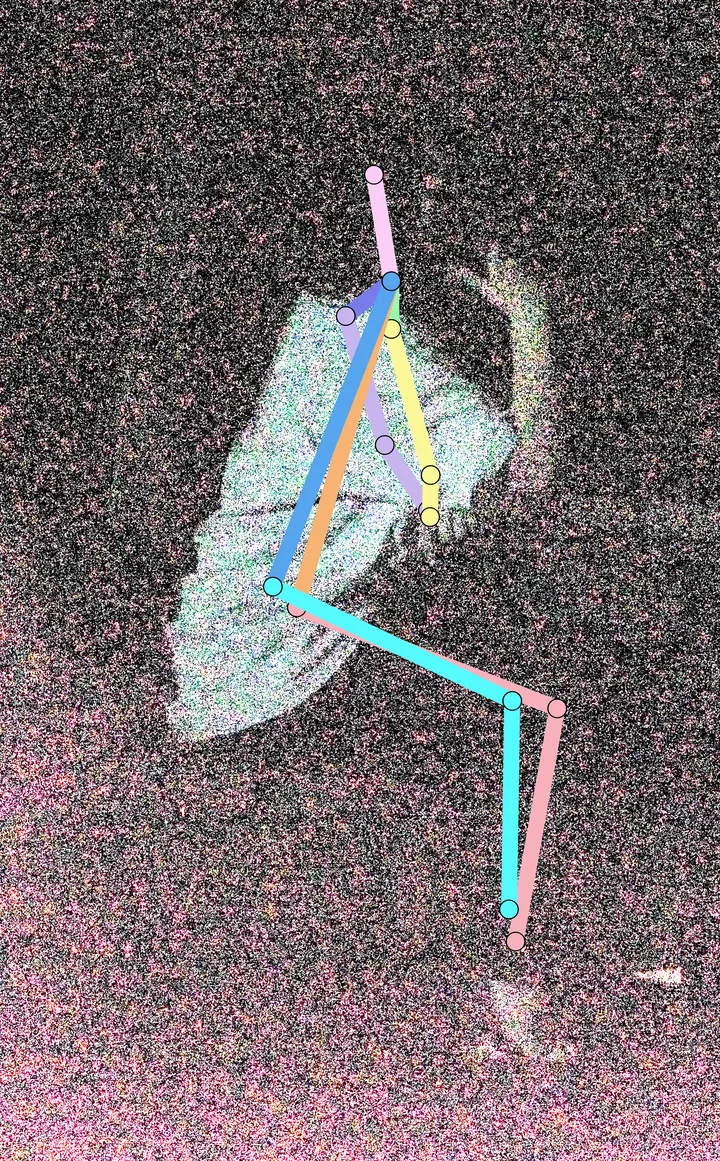
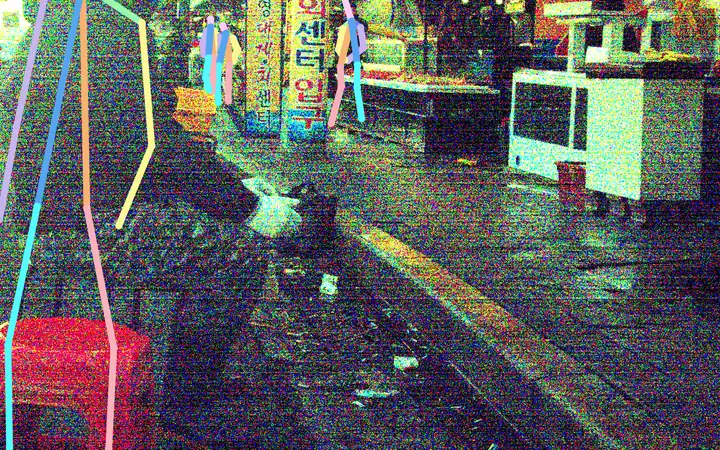
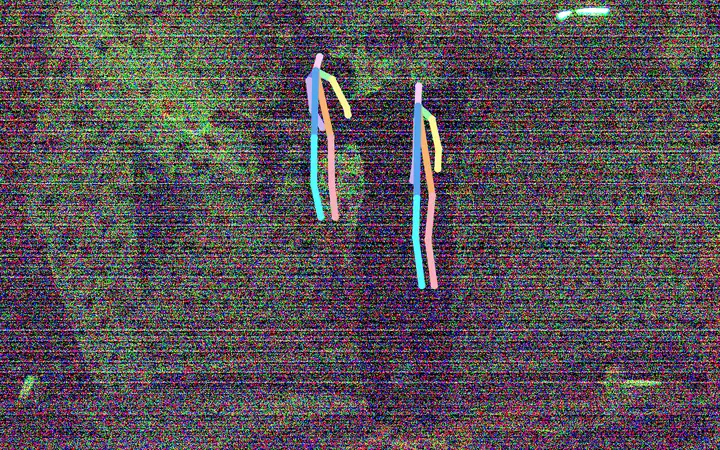
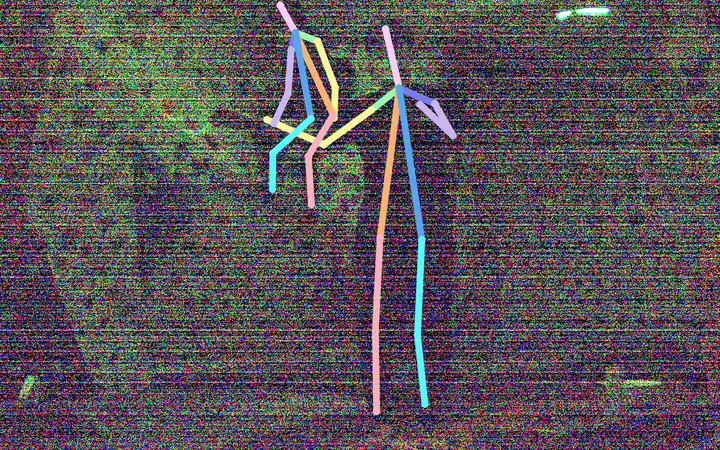
A real night test image of three people, brightened for display, with the closest detections drawn.
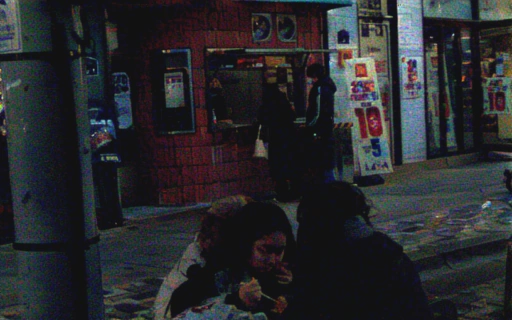
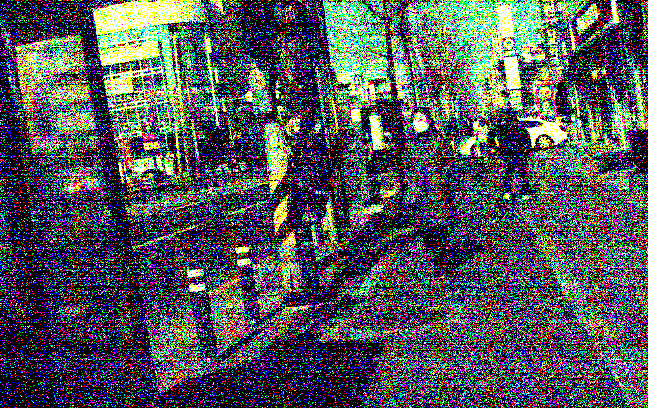
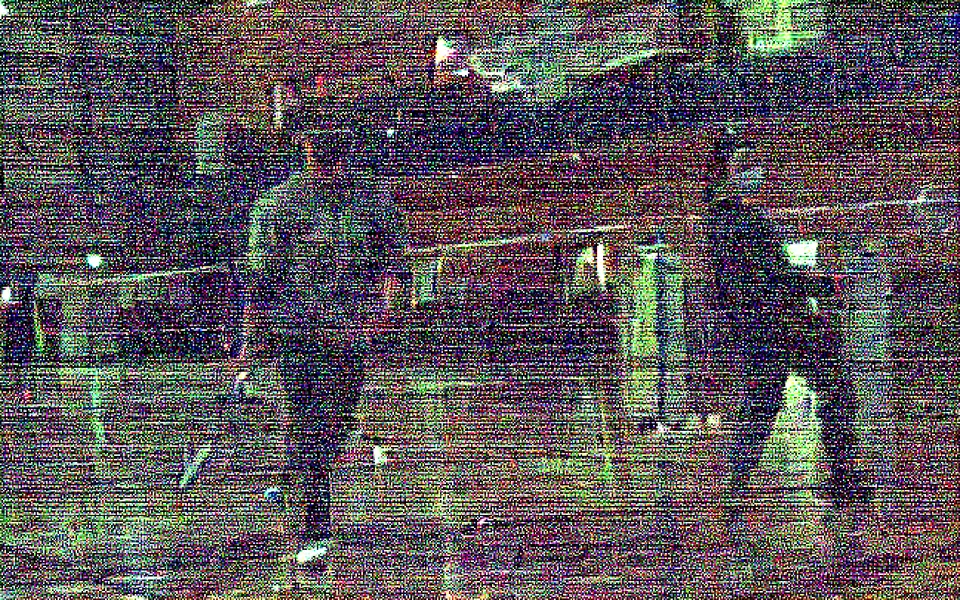
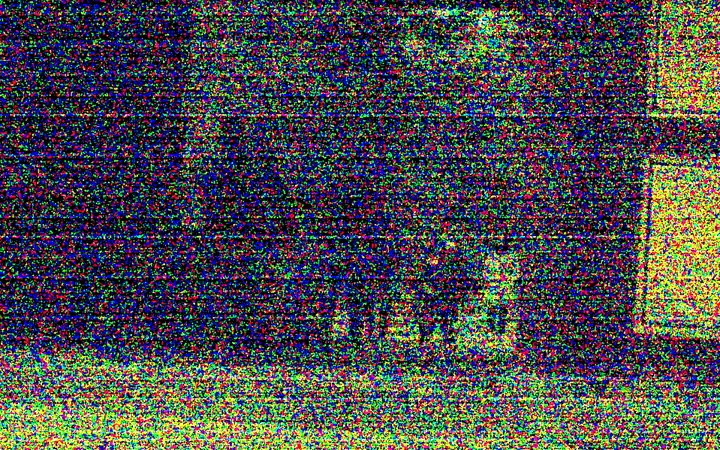
The paired well-lit photo from the second camera.
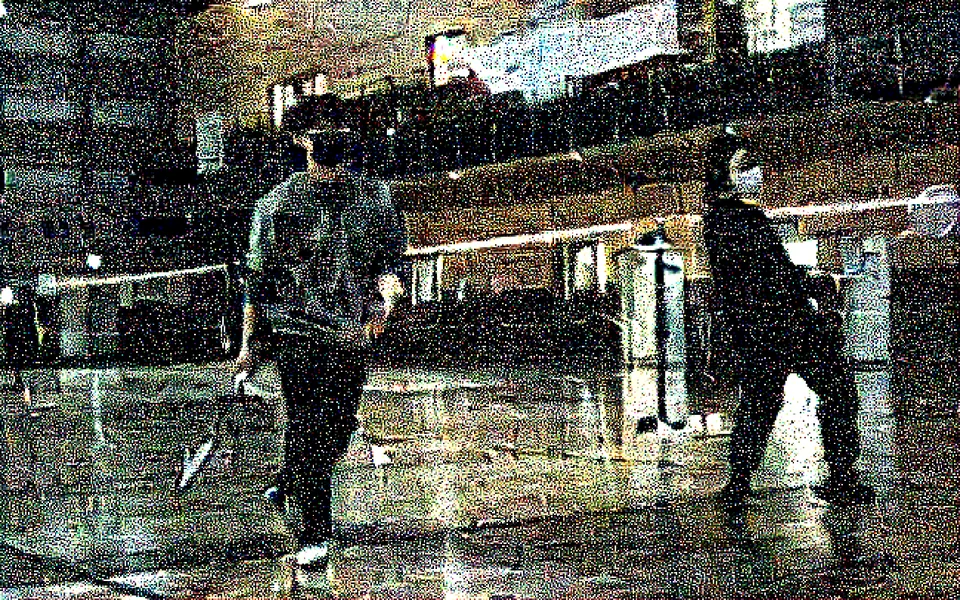
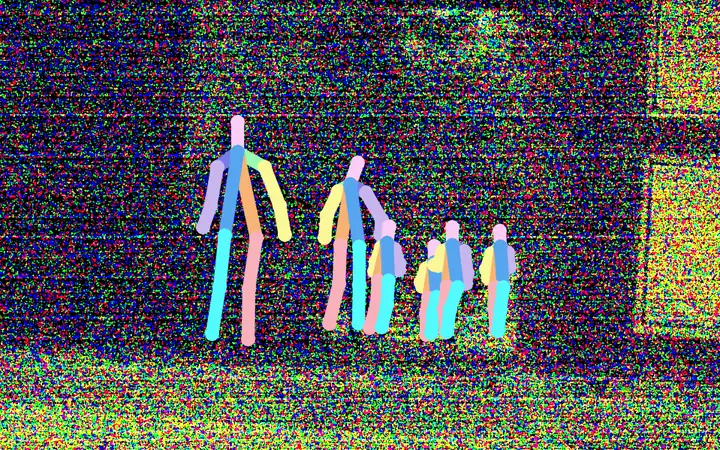
UDAPose
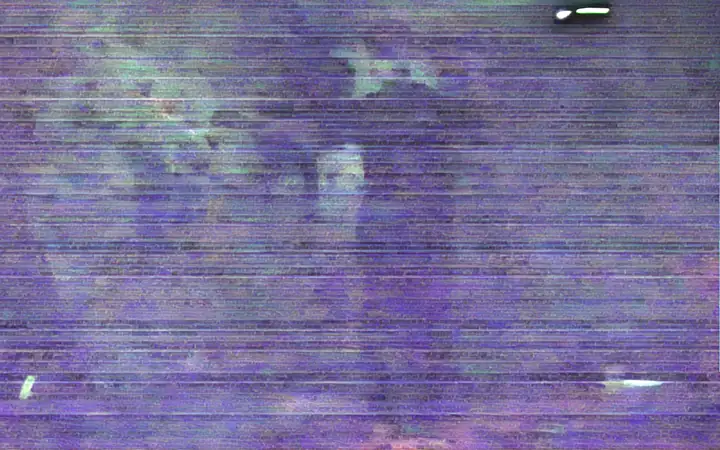
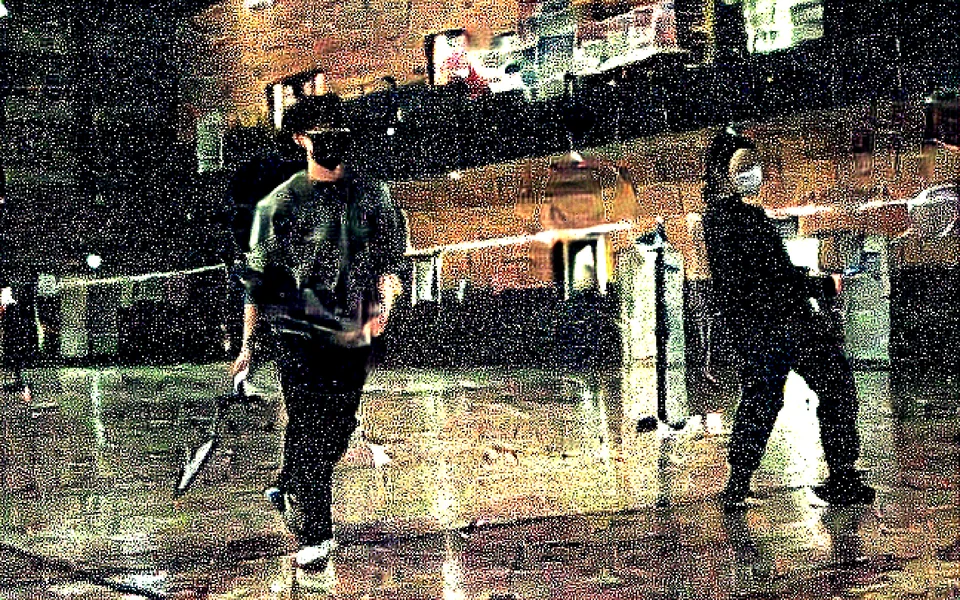
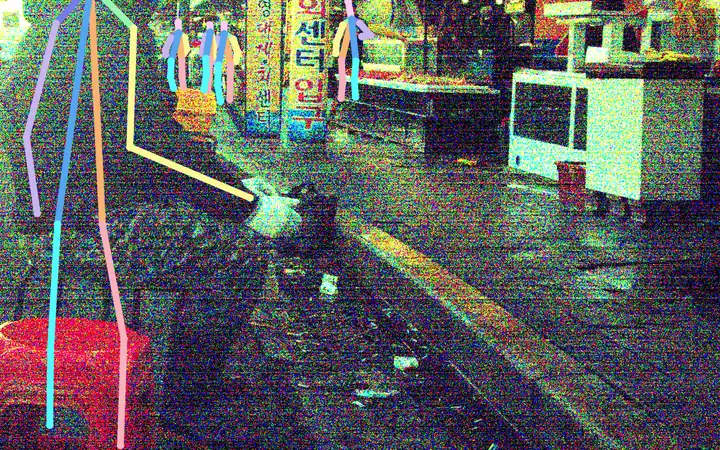
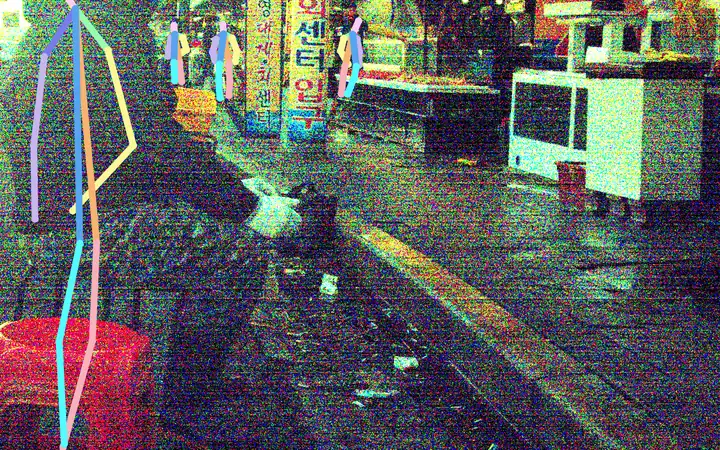
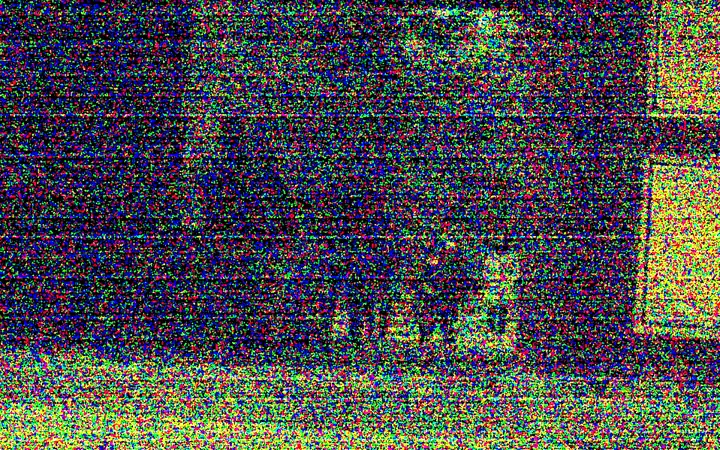
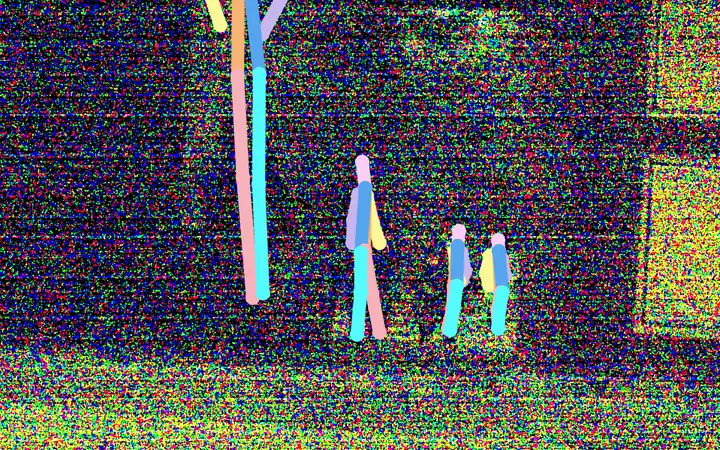
The same image, brightened for display, with the well-lit model's closest detections drawn.
The paired well-lit photo from the second camera.
Well-lit model
true pixels
The well-lit model is trained on well-lit images only. Real night is ExLPose-OCN; Filtered is ExLPose-test.

UDAPose learns pose estimation for the dark from well-lit labels alone. It synthesizes low-light training images from labeled well-lit ones, using unlabeled dark images as references, and adaptively fuses image cues with learned pose priors.

0low-light labels used
+10.1 AP(56.4%) on LL-H over the best baseline
11.7 vs 3.4AP on LL-E, more than 3x ELLA's augmentation in ED-Pose
+7.4 AP(31.4%) cross-dataset, EHPT-XC

Abstract

Low-visibility scenarios, such as low-light conditions, pose significant challenges to human pose estimation due to the scarcity of annotated low-light datasets and the loss of visual information under poor illumination. Recent domain adaptation techniques attempt to utilize well-lit labels by augmenting well-lit images to mimic low-light conditions. But handcrafted augmentations oversimplify noise patterns, while learning-based methods often fail to preserve high-frequency low-light characteristics, producing unrealistic images that lead pose models to generalize poorly to real low-light scenes. Moreover, recent pose estimators rely on image cues through image-to-keypoint cross-attention, but these cues become unreliable under low-light conditions. To address these issues, we propose Unsupervised Domain Adaptation for Pose Estimation (UDAPose), a novel framework that synthesizes low-light images and dynamically fuses visual cues with pose priors for improved pose estimation. Specifically, our synthesis method incorporates a Direct-Current-based High-Pass Filter (DHF) and a Low-light Characteristics Injection Module (LCIM) to inject high-frequency details from input low-light images, overcoming rigidity or the detail loss in existing approaches. Furthermore, we introduce a Dynamic Control of Attention (DCA) module that adaptively balances image cues with learned pose priors in the Transformer architecture. Experiments show that UDAPose outperforms state-of-the-art methods, with notable AP gains of 10.1 (56.4%) on the ExLPose-test hard set (LL-H) and 7.4 (31.4%) in cross-dataset validation on EHPT-XC. Code: VMIL/UDAPose.

Samples

Comparison with other methods

Swipe a row to see UDAPose. QuadPrior and LightenDiff brighten the test image before pose estimation, and their panels show the brightened result. CycleGAN darkens the well-lit training images. ELLA here is its low-light augmentation in ED-Pose; the full framework is under Questions. Every model was run on these images for this page.

Pose estimators go blind in the dark

A model trained on well-lit images scores 60.1 AP in good light. On the low-light subsets of ExLPose-test it scores 3.4, 0.4 and 0.2.

Table 5, row "Well-lit". AP @0.5:0.95 on ExLPose-test.

Labels for dark images barely exist, because people cannot see the joints either. Well-lit labels are plentiful. Can we reuse them?

Two routes, and what each one loses

Route A: brighten first

An LL-E image brightened by DarkIR, heavy noise, no skeleton on the person. Rendered by the authors.
DarkIR
An LL-E image brightened by QuadPrior, smooth and blurry, no skeleton on the person. Rendered by the authors.
QuadPrior

Enhance, then run a well-lit pose model. Recovering lost detail is ill-posed, and artifacts mislead the model.

Best enhancement AP on LL-H: 4.6 (QuadPrior, Table 1).

Route B: darken labeled images for training

Well-lit image darkened by CycleGAN.
CycleGAN
Well-lit image darkened by StyleID. Dark and smooth, with the scene visible.
StyleID

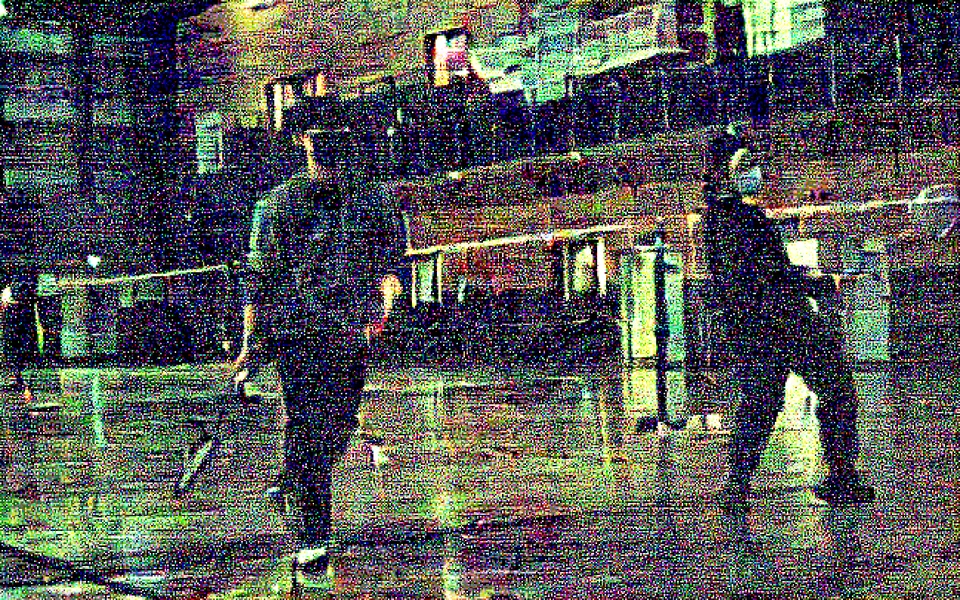
Keep the labels and train on synthetic darkness. Handcrafted noise oversimplifies: ELLA uses Gaussian noise. CycleGAN over-darkens and adds lighting artifacts; StyleID misses the noise.

Best translation AP on LL-H: 17.9 (CycleGAN, Table 1).

Left: an LL-E image rendered by the authors. Right: panels from the paper's Fig. 10, brightened for display.

Low light is low brightness plus a noise texture

Move the magnifier on any panel. All five follow.
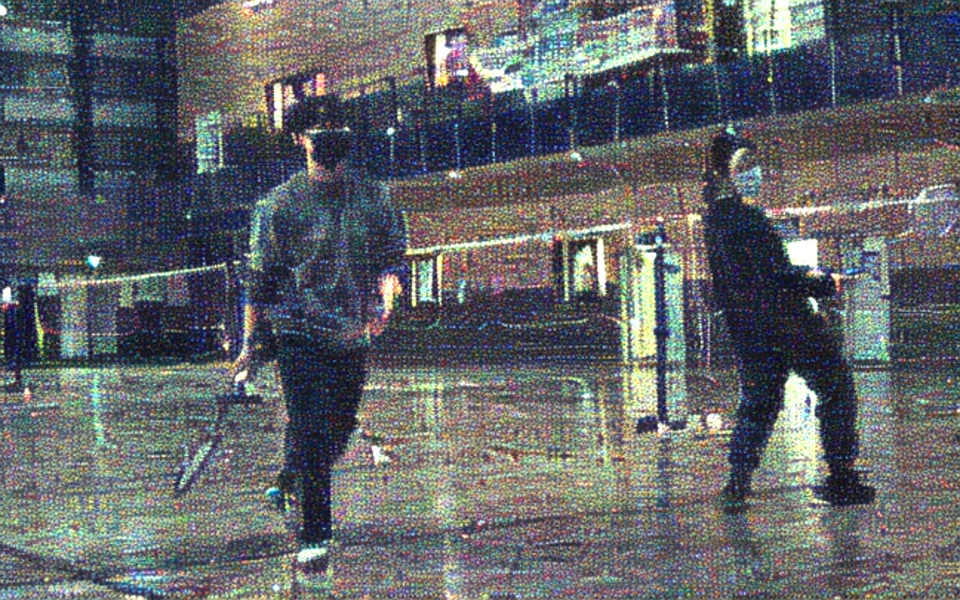
The well-lit photo.
Well-lit
The paired low-light image, optically filtered, brightened for display, with strong color noise.
Paired low-light (optically filtered)
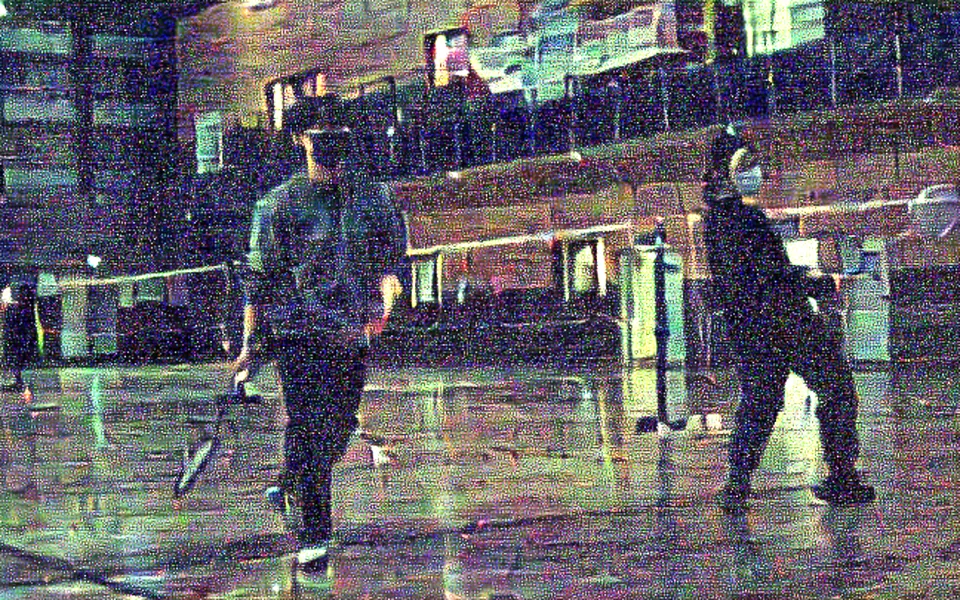
The CycleGAN result.
CycleGAN
The StyleID result: smooth and dark.
StyleID
The UDAPose result, with per-pixel color noise.
UDAPose
11.17 vs 45.70FID
0.20 vs 0.26LPIPS
0.91 vs 0.76SSIM

Table 8: UDAPose vs the best baseline per metric, measured against paired low-light images.

From the paper's Fig. 10. Each low-light panel is brightened for display by its own amount, and the UDAPose panels saturate more than the paired one, so judge the noise texture.

How UDAPose works

1 Two unpaired inputs

A well-lit image with its pose labels, and a low-light reference from a different scene. In the paper, references are unlabeled low-light images from ExLPose and ExLPose-OCN; the released code takes them from the test sets. EHPT-XC is never used, for training or as a reference.

2 Diffusion transfers structure and the low-frequency look

Stable Diffusion 2.1 builds a style-infused latent z0, following StyleID: a compressed image code with the well-lit scene's structure and the reference's overall look. Decoded alone, the result is dark, with soft blotches instead of per-pixel speckle.

3 DHF: take the high frequencies and keep the dark half

DHF extracts the reference's high frequencies and keeps both their bright and dark halves, as the demo in Insight 1 shows.

4 LCIM: inject at four scales

LCIM adds features of IDHF to the decoder at four scales (Insight 1). Now the decoder output has per-pixel noise.

5 Final image: the labels carry over

The channel mean and standard deviation are aligned to the reference. The person has not moved, so the well-lit labels still fit: both panels show the same skeleton.

6 One label, many dark images

Five references give five dark versions and one set of labels. In the paper each well-lit image gets 10 references, which gives 20k training images.

7 Train the pose model on them, with DCA

ED-Pose trains on the synthetic images and inherited labels, with DCA in each decoder layer (Insight 2). The example changes here: training images above, test images below.

8 At test time, dark images go straight in

The trained model reads the dark pixels directly, with no enhancement step and no reference image.

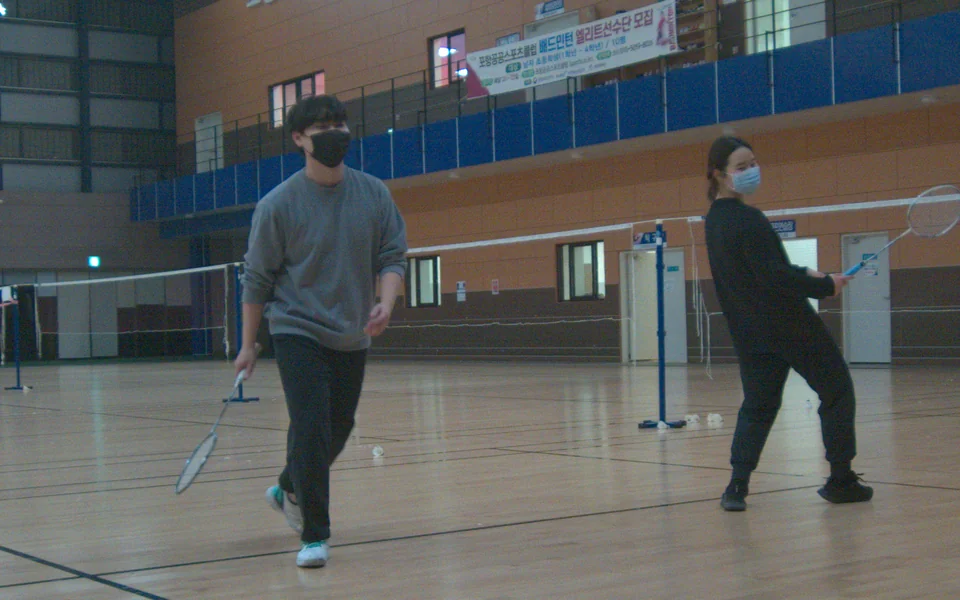
Well-lit image with labels
Well-lit photo of two people playing badminton in a sports hall, with their labeled skeletons.
Low-light reference, no labels
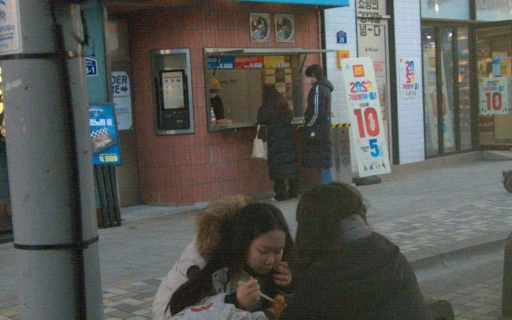
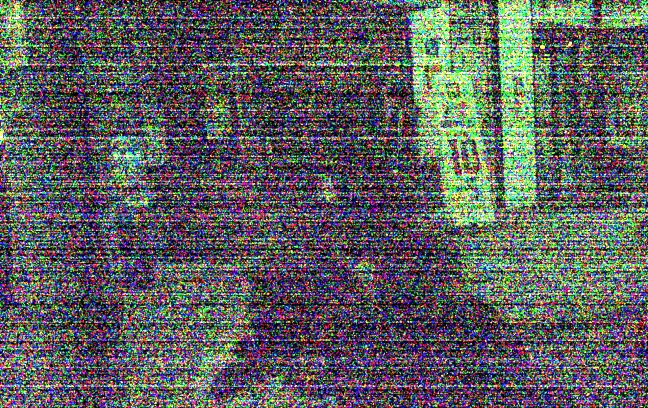
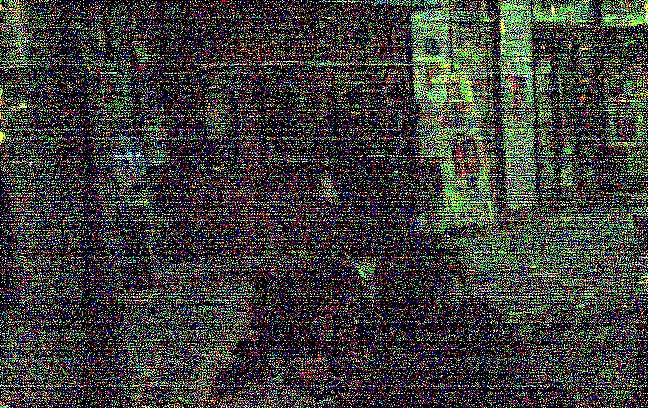
Low-light street photo used as the style reference, brightened for display.The same reference with its true pixels: almost black.
Brightened. Inset: true pixels.
Stable Diffusion 2.1-baseOutput: style-infused latent z0.
z0
VAE decoder
d1d2d3d4final
LCIM
f1f2f3f4
encoder features z1 to z4
DHF
The reference after intensity normalization.
1. Normalized
The high-pass image clipped to the 0 to 1 range: most dark detail is gone.
2. High-pass, clipped
The recentered high-pass image: gray with fine detail.
3. Recentered: IDHF
Vanilla VAE, same pair
Decoder output of the vanilla VAE, brightened for display: soft blotches instead of per-pixel speckle.
Soft blotches, no per-pixel speckle.
With DHF + LCIM
Decoder output with DHF and LCIM, brightened for display: per-pixel speckle.
Per-pixel speckle. Both are before the final alignment.
Final image, well-lit labels drawn
The final synthetic low-light image with the labeled skeletons on it.
Well-lit image, same labels
The well-lit image with the same skeletons.
The labeled well-lit image.
One set of labels
Synthetic image with an LL-N reference.
LL-N reference
Synthetic image with an LL-H reference.
LL-H reference
Synthetic image with an LL-E reference.
LL-E reference
Synthetic image with an A7M3 reference.
A7M3 reference
Synthetic image with a RICOH3 reference.
RICOH3 reference

In the paper: about 2k well-lit images.

Train
Test
Synthetic low-light images
Synthetic low-light training images, stacked.
Pose model: ED-Pose with a Swin-T backbone
Swin-T featuresTransformer encoder
Each decoder layer
Self-attention
Qpose: pose prior
Cross-attention
Qimage: image cues
DCA: per-keypoint weighted sum FFN Output Boxes and 14 keypoints per person
Loss against the inherited labels
Synthetic image with the labels used for training.
Low-light test image, true pixels
An LL-H test image with its true pixels: almost black.
Predicted pose
The same test image, brightened for display, with the four UDAPose detections at score at least 0.3.
Detections with score ≥ 0.3.
Schematic based on the paper's Fig. 3, with images from the released synthetic dataset. We computed the step 4 comparison (vanilla VAE against DHF + LCIM) with the released code. Panels are brightened for display unless marked as true pixels. The vanilla panel keeps the release config's alignment steps, so it is not the Table 5 "Baseline SD" row.

Insight 1

Low-light noise lives in the high frequencies

The latent path gives dark images with soft blotches instead of per-pixel speckle (step 2). So high frequencies get their own path: DHF extracts them from the reference, and LCIM puts them back. The payoff in Table 5: on top of Baseline SD, AIN and LCIM lift LL-H from 7.2 to 20.7 AP and LL-E from 0.0 to 7.8.

Clipping throws away the dark half

A high-pass image has a mean near zero, so about half its values are negative. The SD encoder expects values in [0, 1]. Clip directly and the dark half is gone. DHF shifts the signal first.

  1. Adaptive Intensity Normalization (AIN) Scale the reference by one factor, toward a mean of 0.449 (Eq. 15).
  2. High-pass FFT, mask, inverse FFT (Eq. 1).
  3. Recenter Add back the difference of the means (Eq. 2).

IDHF = IHP + (mean(ILL) − mean(IHP))(2)

kept in [0, 1]lost to clipping
52.84%
of values lost by clipping directly
High-pass image clipped directly to [0, 1]. Most of it is dark, and the negative half is gone. The recentered image. Gray, with both bright and dark fine detail.

On this image, DHF cuts the lost values from 52.84% to 13.38%.

Computed with the released code (util/fft.py) on one LL-H reference. The panel is not brightened.

LCIM puts them back, one scale at a time

Encoder features of IDHF at four scales pass through a lightweight convolution, and each result is added at the end of a decoder block. Every added scale raises AP on every low-light column of Table 11.

LCIM is trained with the VAE frozen, to reconstruct low-light images with MSE plus a frequency loss weighted toward mid-to-high frequencies. Because its input is mostly noise, it captures characteristics that transfer to other images (Sec. 3).

LD = LMSE(I, Î) + λ Lfreq(I, Î)(5)

z₀ out
z0 to z4
Left: schematic. Right: Table 11. All rows include AIN, DHF and DCA, so "z0" is not the Table 5 "Baseline SD" row.
Table 11 and Table 10 in full
Table 11. LCIM scales, cumulative (AP @0.5:0.95, with AIN, DHF and DCA).
MethodWLLL-NLL-HLL-EA7M3RICOH3EHPT-XC
z066.829.712.10.140.036.811.3
z0, z166.831.419.22.441.437.415.4
z0, z1, z267.235.323.25.843.839.926.2
z0, z1, z2, z367.437.726.57.747.943.729.7
z0, z1, z2, z3, z467.338.728.011.755.047.931.0
Table 10. Normalizing the reference before the SD encoder (AP @0.5:0.95, DEKR setup).
MethodWLLL-NLL-HLL-EA7M3RICOH3
Direct input60.823.77.30.027.324.3
Z-score-based norm.60.925.413.22.228.425.0
Fixed factor58.129.020.86.433.231.0
ImageNet-based61.331.722.47.436.533.8
UDAPose61.532.323.28.337.235.0

Insight 2

A pose decoder cannot look away

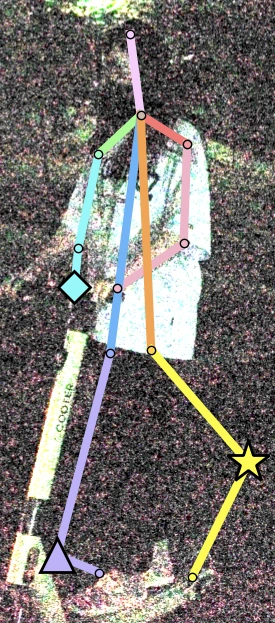
DETR-style pose decoders add two signals with a fixed residual: Qpose, the pose prior from self-attention, and Qimage, the image cues from cross-attention. In the dark the image cues are unreliable, and a fixed sum cannot back off.

Both knees barely visible
image, about 1.7
prior, 1
Well-lit images
image, about 1.68
prior, 1

Ratio of norms without DCA (Sec. 3). Barely visible knees stay comparable to clearly visible keypoints.

Person with a scooter. Without DCA the right knee sits out on empty background and the left knee sits down near the foot.
Before DCA: knees off the leg
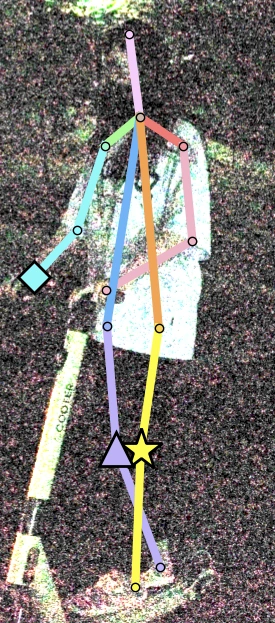
Same person with DCA. Both knees sit on the leg.
After DCA: both knees on the leg
From the paper's Fig. 4. Star and triangle mark the knees.

DCA lets each keypoint choose

Dynamic Control of Attention concatenates the two signals, runs a two-layer MLP, and applies a softmax. That gives two competing weights per keypoint. Their weighted sum replaces the fixed residual.

Q pose Q image Concat Two-layer MLP Softmax ⊙ ⊙ ⊕ FFN w posew image Q pose Q image Concat Two-layer MLP Softmax ⊙ ⊙ ⊕ FFN w posew image
Redrawn from the paper's Fig. 6. Pose prior in teal, image cues in amber.

(wpose, wimage) = softmax(MLP(Qcat))(9)

Q = wpose ⊙ Qpose ⊕ wimage ⊙ Qimage(10)

The cost is two linear layers: 39 ms against 37.4 ms per image.

What it changes, joint by joint

Two cases from the paper's Fig. 8. The chart shows the norm ratio, not the DCA weights: lower means the image cues count for less against the prior. The ratio stays above 1, so DCA turns the image cues down without switching them off.

norm ratio ‖Qimage‖ / ‖Qpose‖1.02.0

Case A

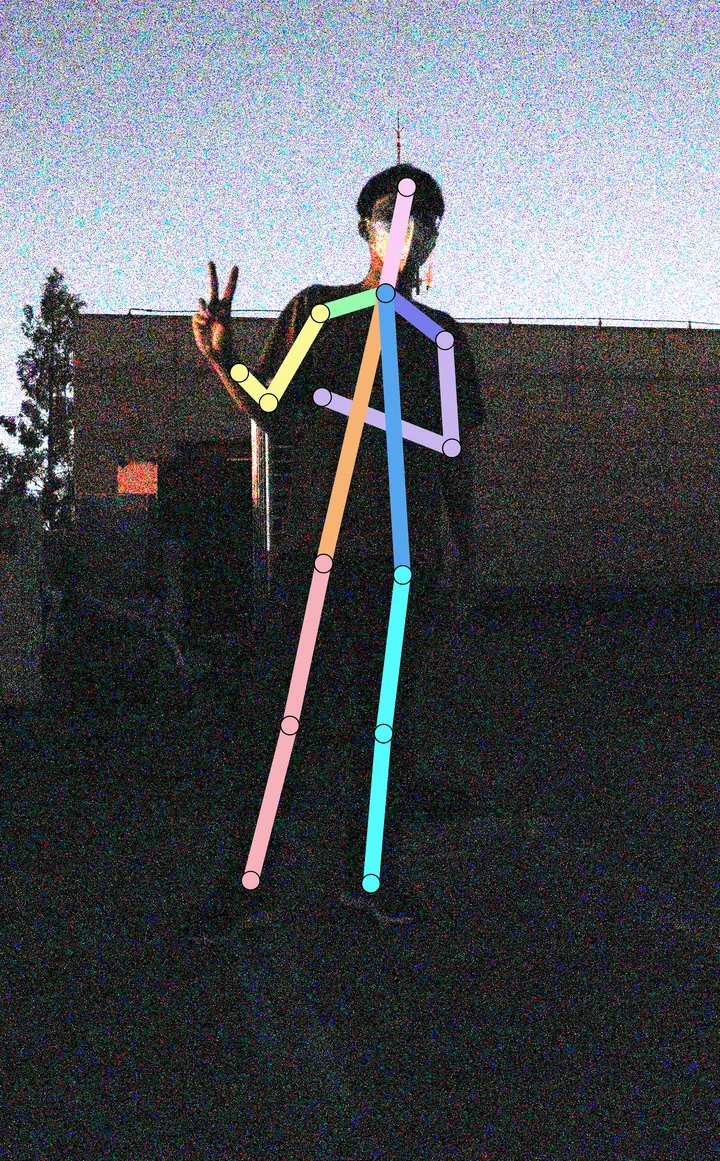
Before DCA: the left arm curls across the chest.After DCA: the left arm hangs straight.

Case B

Before DCA: the legs run down and out to where no foot is.After DCA: the ankles land near the visible foot.

Values from the paper's Fig. 8, drawn on a schematic figure facing you.
  • Case A. The arm across the dark shirt falls (L. elbow 1.72 to 1.41, L. wrist 1.69 to 1.24). The legs fall (knees about 1.85 to 1.55). The visible head holds (1.89 to 1.93).
  • Case B. The invisible knees and ankles fall: knees 1.83 to 1.13 and 1.86 to 1.17, ankles 1.88 to 1.31 and 1.87 to 1.35.
  • Not every drop maps to a hidden joint: in Case A the right wrist falls 1.74 to 1.49 with the hand visible.
All 14 joints for both cases
Fig. 8. Ratio of the norms of Q_image and Q_pose per joint.
JointCase A beforeCase A afterCase B beforeCase B after
L. shoulder1.731.741.741.71
R. shoulder1.811.781.711.74
L. elbow1.721.411.821.73
R. elbow1.771.471.811.72
L. wrist1.691.241.851.74
R. wrist1.741.491.841.93
L. hip1.701.721.911.75
R. hip1.801.811.931.73
L. knee1.851.551.831.13
R. knee1.841.571.861.17
L. ankle1.761.511.881.31
R. ankle1.811.521.871.35
Head1.891.931.791.84
Neck1.821.891.821.70

Does it help?

At the same decoder position, on the same synthetic data, DCA leads SE-Block and CBAM on every column of Table 12. It also helps in good light: AP on WL rises from 60.2 to 67.3 (Table 5).

Table 12. AP @0.5:0.95.
Table 12 in full
Table 12. Fusion gates at the same decoder position (AP @0.5:0.95).
MethodWLLL-NLL-HLL-EA7M3RICOH3EHPT-XC
SE-Block62.436.726.39.550.346.526.7
CBAM62.537.026.29.851.146.227.0
Ours (DCA)67.338.728.011.755.047.931.0
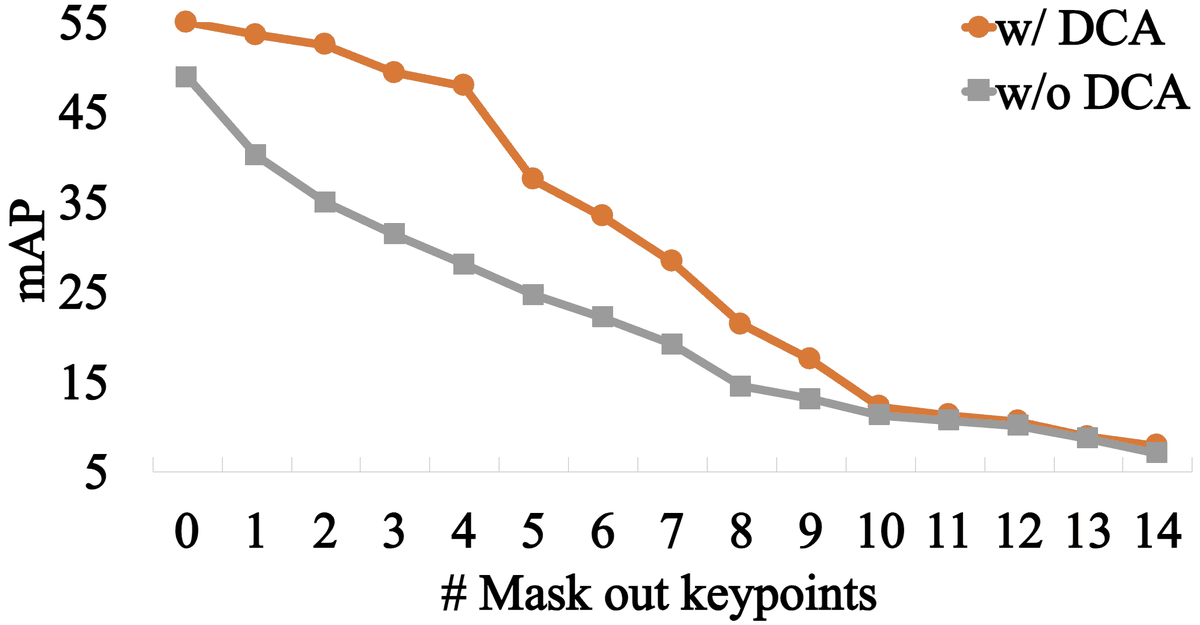
Line chart of mAP against the number of masked keypoints, 0 to 14, with and without DCA. With DCA stays higher until about 10 masked keypoints, where the lines meet.
The paper's Fig. 7b: random keypoints masked on A7M3. The gap narrows once most keypoints are masked, because with few visible joints the pose prior has little to build on.

Results

All methods use ED-Pose as the backbone. The UDAPose row also includes DCA, and Table 5 below separates the pieces.
ExLPose-OCN is real night; ExLPose-test is optically filtered. EHPT-XC is cross-dataset, with no retraining: 12 low-light scenes, 1200 images, selected from its merged train and test splits (Sec. 4). Hover, tap or focus a bar for the gap.

The same gap, in images

LL-N
Input on an LL-N test image, from the paper's Fig. 5.
Input
QuadPrior on an LL-N test image, from the paper's Fig. 5.
QuadPrior
ELLA on an LL-N test image, from the paper's Fig. 5.
ELLA
UNSB on an LL-N test image, from the paper's Fig. 5.
UNSB
UDAPose on an LL-N test image, from the paper's Fig. 5.
UDAPose
LL-H
Input on an LL-H test image, rendered by the authors.
Input
QuadPrior on an LL-H test image, rendered by the authors.
QuadPrior
ELLA on an LL-H test image, rendered by the authors.
ELLA
UNSB on an LL-H test image, rendered by the authors.
UNSB
UDAPose on an LL-H test image, rendered by the authors.
UDAPose
LL-E
Input on an LL-E test image, from the paper's Fig. 5.
Input
QuadPrior on an LL-E test image, from the paper's Fig. 5.
QuadPrior
ELLA on an LL-E test image, from the paper's Fig. 5.
ELLA
UNSB on an LL-E test image, from the paper's Fig. 5.
UNSB
UDAPose on an LL-E test image, from the paper's Fig. 5.
UDAPose
The LL-N and LL-E rows are from the paper's Fig. 5; the LL-H row was rendered by the authors. The authors picked all of them, with no fixed score threshold, and we cropped and brightened them for display. Swipe a row for the other methods.

The darker, the larger the lead

In relative terms the lead grows with darkness: 1.15x, 1.56x, 3.44x. The absolute gain is 5.0, 10.1 and 8.3 AP, so it peaks on LL-H.

Table 1, best baseline per subset: CycleGAN on LL-N and LL-H, ELLA on LL-E.

What each piece adds

Table 5 adds the modules one at a time. Synthesis alone (the "+ DHF" row, no DCA) leads the best baseline by 7.4 AP on LL-H and by 0.8 on EHPT-XC. DCA adds the rest.

Table 5. AP @0.5:0.95.
Full results tables (Tables 1 to 5)
Table 1. AP on ExLPose-test (@.50:.95).
MethodWLLL-ALL-NLL-HLL-E
RFormer60.04.515.20.30.8
DarkIR60.26.117.41.31.2
LightenDiff60.15.613.90.70.8
QuadPrior60.28.919.34.60.3
CycleGAN61.319.633.717.93.3
UNIT54.17.416.13.60.9
UNSB57.515.828.313.81.8
EnCo60.017.231.916.22.9
UDA-HE53.413.222.412.71.8
ELLA61.518.632.317.23.4
UDAPose67.327.038.728.011.7
Table 2. AR on ExLPose-test (@.50:.95).
MethodWLLL-ALL-NLL-HLL-E
RFormer71.59.725.44.10.6
DarkIR72.011.129.37.30.8
LightenDiff71.810.222.94.90.5
QuadPrior71.915.530.911.71.0
CycleGAN72.128.745.627.48.9
UNIT68.014.226.710.33.3
UNSB69.423.839.722.55.7
EnCo71.827.441.526.35.7
UDA-HE67.221.432.720.95.8
ELLA72.728.945.028.09.7
UDAPose75.036.548.237.420.4
Table 3. ExLPose-OCN (@.50:.95).
MethodAP Avg.AP A7M3AP RICOH3AR Avg.AR A7M3AR RICOH3
RFormer27.529.425.743.747.240.3
DarkIR28.930.327.647.048.745.4
LightenDiff25.329.121.540.645.435.9
QuadPrior29.330.628.048.850.447.2
CycleGAN45.147.542.760.763.757.8
UNIT35.140.729.655.261.948.6
UNSB41.643.539.859.760.958.5
EnCo43.245.441.158.461.555.4
UDA-HE39.242.436.057.161.852.4
ELLA46.048.543.562.365.559.1
UDAPose51.455.047.965.168.162.2
Table 4. Cross-dataset validation on EHPT-XC.
MethodAP @.50:.95AP @.50AP @.75AR @.50:.95AR @.50AR @.75
RFormer8.820.37.921.339.218.9
DarkIR12.525.211.328.948.527.1
LightenDiff9.717.78.322.038.420.3
QuadPrior12.924.511.528.147.727.5
CycleGAN20.736.919.245.069.645.5
UNIT11.224.58.735.564.232.5
UNSB16.930.115.740.567.139.2
EnCo18.333.417.142.368.142.8
UDA-HE15.429.614.838.766.737.8
ELLA23.638.322.748.273.248.6
UDAPose31.051.130.351.376.453.8
Table 5. Ablation of the modules (AP @0.5:0.95).
RowWLLL-NLL-HLL-EA7M3RICOH3EHPT-XC
Well-lit60.13.40.40.211.313.40.3
HM60.021.31.30.515.111.41.5
Baseline SD60.023.77.20.030.125.43.2
+ AIN60.125.28.82.433.027.86.1
+ LCIM60.131.520.77.843.139.819.5
+ DHF60.235.325.39.448.945.624.4
+ DCA67.338.728.011.755.047.931.0

Questions you might ask

Do the labels stay valid?

Predict pose heatmaps on a synthetic image and on its paired low-light image, then take the KL divergence. Lower means the joints stayed where the labels say. UDAPose scores 0.008 against 0.028 for the best baseline, with SSIM 0.91.

Table 8, KL. Heatmaps from DEKR.

Table 8 in full
Table 8. Anatomical consistency of the synthetic images.
MethodPSNRSSIMLPIPSFIDKL
CycleGAN36.560.760.2650.200.028
UNIT33.900.660.2945.700.104
UNSB34.190.740.3096.420.062
EnCo35.990.750.2848.710.031
UDAPose41.130.910.2011.170.008

What if I have more well-lit data?

AP goes up. CrowdPose as the source, about 6x larger, takes A7M3 from 55.0 to 70.5 and RICOH3 from 47.9 to 69.7, close to its own well-lit AP of 71.7.

Table 6, AP. In Table 7, gains are larger below 12k synthetic images; the paper uses 20k.

Tables 6 and 7 in full
Table 6. ExLPose or CrowdPose as the well-lit source (AP @0.5:0.95).
MethodWLLL-NLL-HLL-EA7M3RICOH3EHPT-XC
Ours (ExLPose)67.338.728.011.755.047.931.0
Ours (CrowdPose)71.747.937.219.470.569.745.7
Table 7. AP vs amount of synthetic training data.
MethodWLLL-NLL-HLL-EA7M3RICOH3EHPT-XC
4,00066.134.722.45.450.045.125.4
8,00066.335.424.87.853.246.827.9
12,00066.936.626.210.454.747.229.1
16,00066.837.527.311.355.047.830.5
20,00067.338.728.011.755.047.931.0

Why not ControlNet or IP-Adapter on paired data?

Both get pixel-level supervision from paired images, which UDAPose does not need. All rows have DCA on. UDAPose still leads on every column, by 10.9 AP on LL-H over the better of the two.

Table 13, AP on LL-H.

Table 13 in full
Table 13. Paired diffusion conditioning (AP @0.5:0.95).
MethodWLLL-NLL-HLL-EA7M3RICOH3EHPT-XC
ControlNet66.331.716.42.747.643.722.4
IP-Adapter65.831.517.13.548.443.424.1
UDAPose67.338.728.011.755.047.931.0

How does it compare with full ELLA?

This test puts our synthetic data inside ELLA's own DEKR pipeline, without DCA. The student rises from 18.6 to 27.4 AP on LL-H. A supervised baseline with low-light labels, LSBN+LUPI, reaches 14.7.

Table 9, AP on LL-H.

Table 9 in full
Table 9. Inside the full ELLA framework (AP @0.5:0.95).
MethodWLLL-NLL-HLL-EA7M3RICOH3
Main (ELLA)62.129.413.61.635.027.2
Main (Ours)61.532.323.28.337.235.0
Comp. (ELLA)60.327.811.90.833.926.5
Comp. (Ours)60.831.722.46.736.833.9
Student (ELLA)60.835.618.65.039.136.2
Student (Ours)61.139.427.49.441.339.3
LSBN+LUPI61.133.714.73.435.335.1

What are the limits?

  • It models darkness only. Fog, heavy rain or strong motion blur would need new synthesis modules.
  • Synthesis costs about 263 ms per image on an RTX 4090.
  • Extreme darkness is still hard: 11.7 AP on LL-E.

Citation

@InProceedings{chen2026udapose, author = {Chen, Haopeng and Ai, Yihao and Kim, Kabeen and Tan, Robby T. and Chen, Yixin and Wang, Bo}, title = {UDAPose: Unsupervised Domain Adaptation for Low-Light Human Pose Estimation}, booktitle = {Proceedings of the IEEE/CVF Conference on Computer Vision and Pattern Recognition (CVPR)}, month = {June}, year = {2026}, pages = {13781-13792} }

Acknowledgment

This work was supported in part by the Mississippi Impact Grant (MIG), Office for Research and Economic Development, University of Mississippi. We thank the anonymous reviewers and the area chair for their constructive feedback, which helped improve this paper.